1.训练数据由images与label组成
y_label_train是图像数据的真实值,每一个数字代表一种图像类型的名称
0 飞机
1 汽车
2 鸟
3 猫
4 鹿
5 狗
6 青蛙
7 马
8 船
9 卡车
2.images的shape形状
print(x_img_train.shape)
(50000, 32, 32, 3)
3.查看图像内容
每一点都是由RGB三原色说组成,RGB共三个数字,数字的范围从0到255,代表图像的RGB颜色.
共32×32=1024个点
[[[ 59 62 63]
[ 43 46 45]
[ 50 48 43]
…
[158 132 108]
[152 125 102]
[148 124 103]]
[[ 16 20 20]
[ 0 0 0]
[ 18 8 0]
…
[123 88 55]
[119 83 50]
[122 87 57]]
[[ 25 24 21]
[ 16 7 0]
[ 49 27 8]
…
[118 84 50]
[120 84 50]
[109 73 42]]
…
[[208 170 96]
[201 153 34]
[198 161 26]
…
[160 133 70]
[ 56 31 7]
[ 53 34 20]]
[[180 139 96]
[173 123 42]
[186 144 30]
…
[184 148 94]
[ 97 62 34]
[ 83 53 34]]
[[177 144 116]
[168 129 94]
[179 142 87]
…
[216 184 140]
[151 118 84]
[123 92 72]]]
4.y_label_shape形状
print(y_label_train.shape)
(50000, 1)
5.定义label_dict字典
label_dict = {0:"airplane",1:"automobile",2:"bird",3:"cat",4:"deer",5:"dog",6:"frog",7:"horse",8:"ship",9:"truck"}
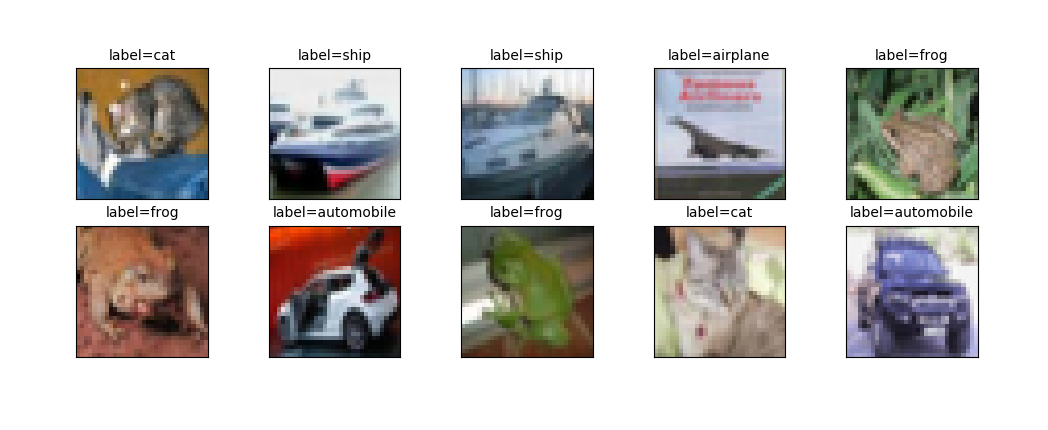
6.查看前10个测试数据
def plot_images_labels_prediction(images,labels,prediction,idx,num=10):
fig = plt.gcf()
fig.set_size_inches(12,14)
if num>25: num=25
for i in range(0,num):
ax=plt.subplot(5,5,1+i)
ax.imshow(images[idx],cmap='binary')
title="label="+str(label_dict[labels[i][0]])
if len(prediction)>0:
title+=",predict="+str(label_dict[prediction[i]])
ax.set_title(title,fontsize=10)
ax.set_xticks([]);ax.set_yticks([])
idx+=1
plt.show()

plot_images_labels_prediction(x_img_test,y_label_test,[],0)